Zabbix - Proxmox monitoring
Table of Contents
Introduction
In the previous HOW TO, I described how to install Zabbix on an LXC container using a script from https://helper-scripts.com
Today, I’ll show you how to add Proxmox server monitoring in Zabbix.
My guide is based on the official Proxmox integration documentation, which you can find here -> https://www.zabbix.com/integrations/proxmox#proxmox.
Now, log in to both Proxmox and Zabbix, and we can get started!
Configuration in Proxmox
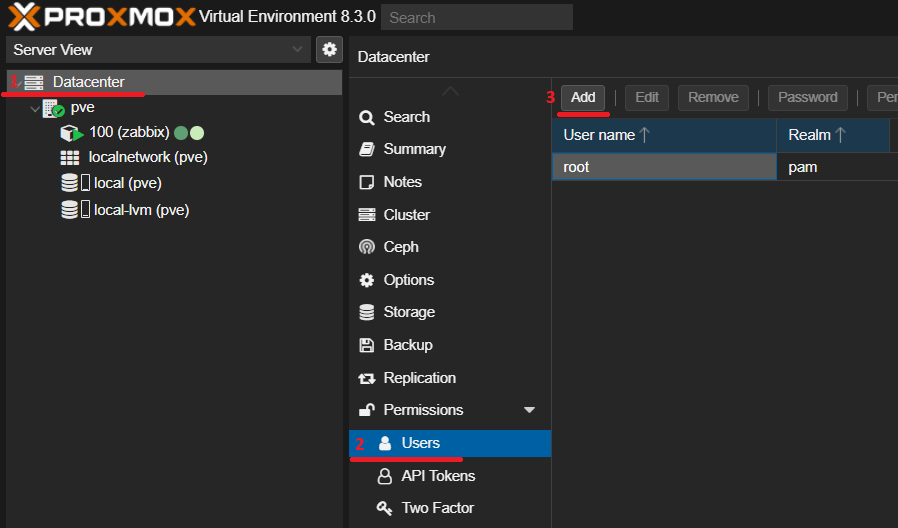
First, we need to create a user in Proxmox, a token, and set the permissions. Go to Datacenter -> Users and click on ADD
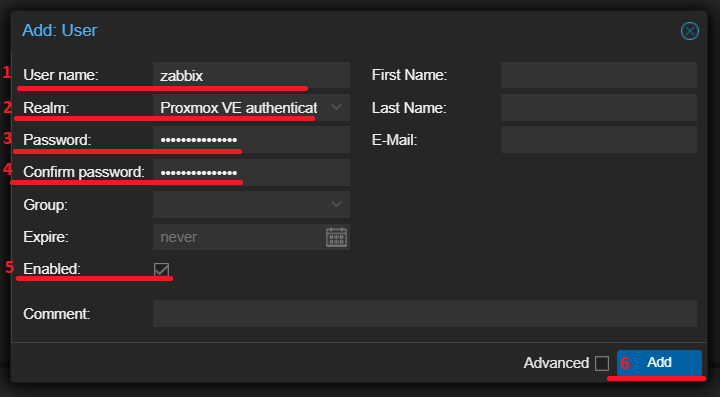
A window will pop up for you to fill in the details for the new user.
Fill in the required info like:
- User name: zabbix
- Realm: select Proxmox VE Authentication from the list
- Password: create a strong password that you can remember
- Confirm password: enter the same password again
- Enable: This option must be checked for this account to be active
Then click ADD in the bottom right corner
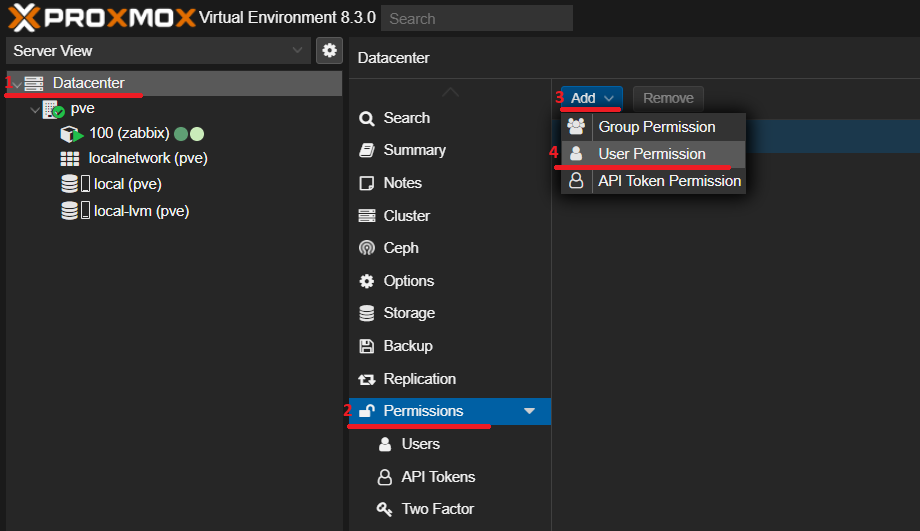
Once done, go to Datacenter -> Permissions -> ADD, and from the dropdown menu, choose User Permission
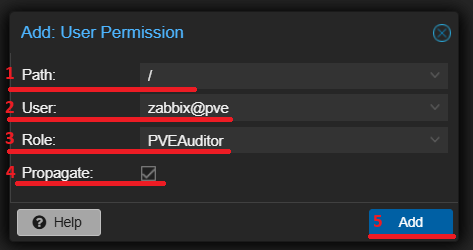
In the Add: User Permission window, set it up as follows:
- Path: /
- User: zabbix@pve
- Role: PVEAuditor
- Propagate: make sure it’s checked
Once it’s all set, click ADD in the bottom right corner
Next, we need to create an API token for the zabbix user.
To do this, go to Datacenter -> API Tokens and click ADD.
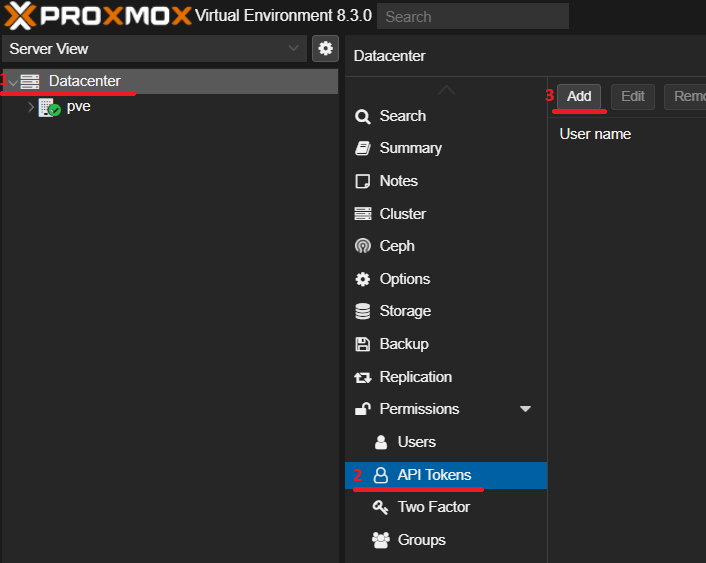
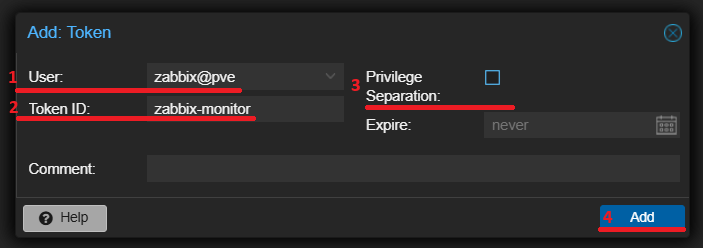
In the window that appears, choose the user, type the Token ID, and uncheck the Privilege Separation option.
- User: zabbix@pve
- Token ID: zabbix-monitor
- Privilege Separation: uncheck this Then you can click ADD in the bottom right corner of the window.
Then click ADD
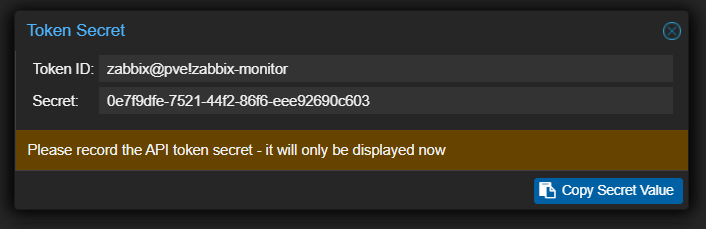
Now, the Token ID and Secret will be displayed on the screen.
Save these details, as you’ll need them later for the Zabbix configuration
The last thing to do is set permissions for the token.
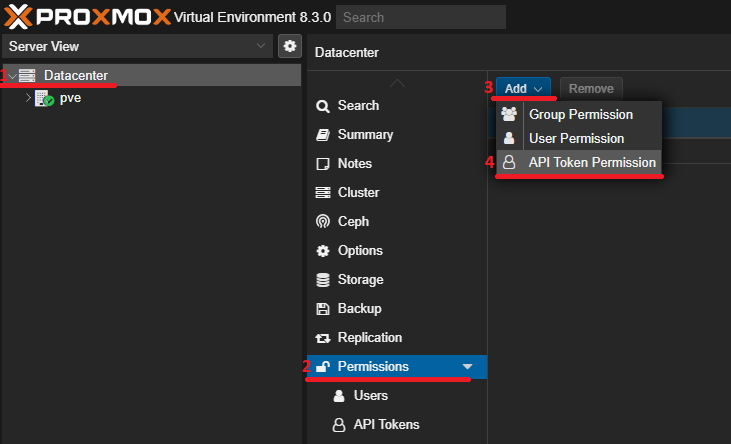
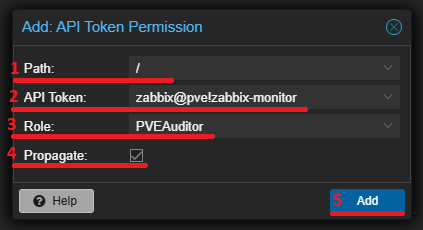
Once again, go to Datacenter -> Permissions -> ADD and from the dropdown, choose API Token Permission
In the Add: API Token Permission window, set:
- Path: /
- API Token: zabbix@pve!zabbix-monitor
- Role: PVEAuditor
- Propagate: check this option! Once everything is set up as shown
Then click ADD in the bottom right corner
And that’s it!
Everything we need is now configured in Proxmox. Let’s move on to the Zabbix configuration.
Zabbix Integration Configuration
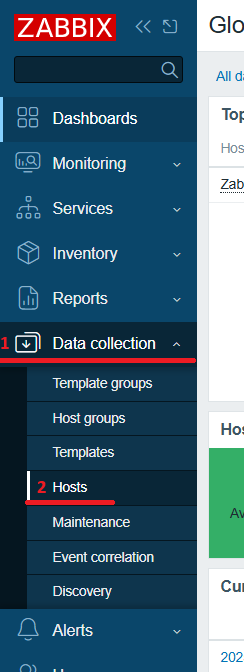
Log in to Zabbix, then from the left menu, click Data collection -> Hosts
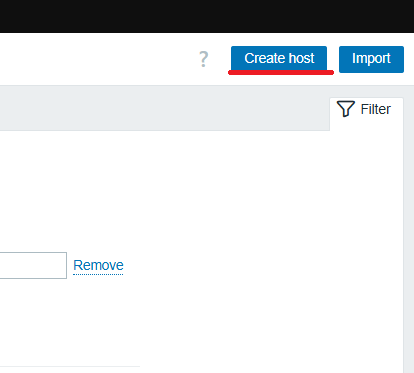
Now, in the top left corner, click Create host
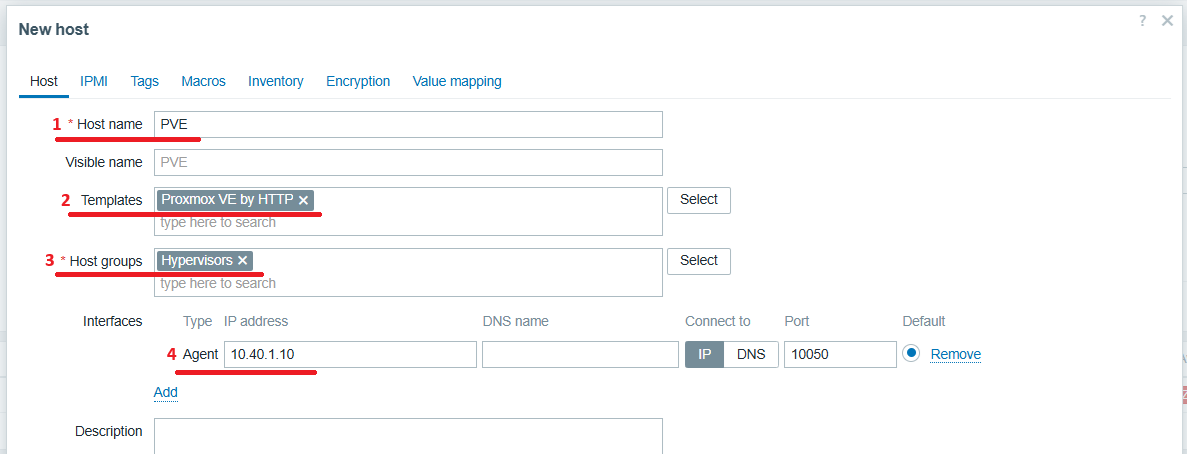
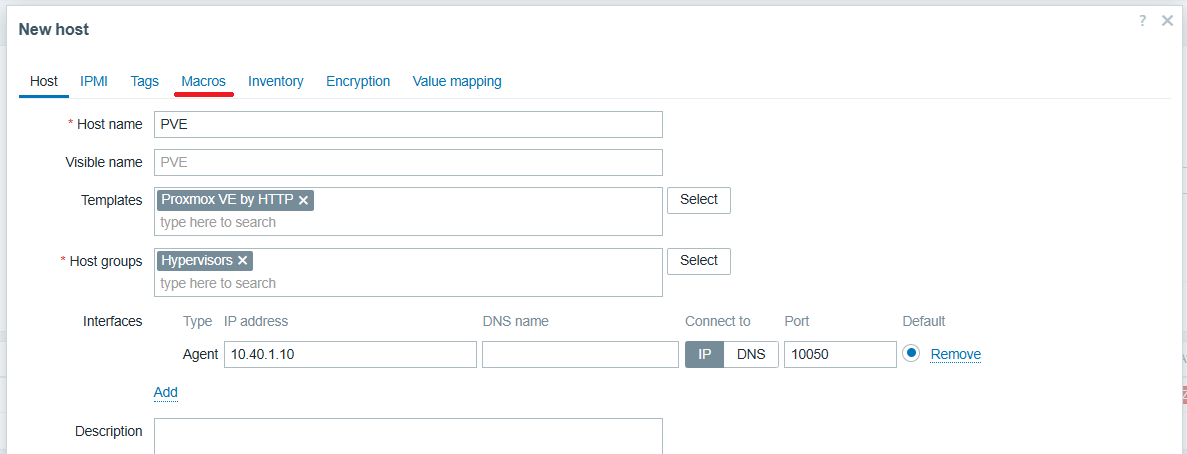
In the New host window, we need to fill in a few details:
- Host name: PVE
- Templates: Type “Proxmox” and select Proxmox VE by HTTP from the list
- Host groups: You can choose “Hypervisors” or any other group you like
- Interfaces: click ADD, choose Agent, and enter the Proxmox server address
This part is ready, but don’t add it yet because we need to set Macros for the host.
To do that, in the New host window, click Macros in the top menu
By default, one Macro is added
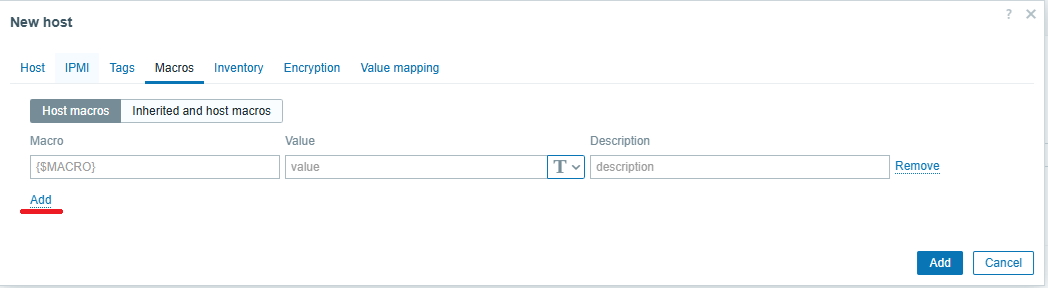
so go ahead and add three more
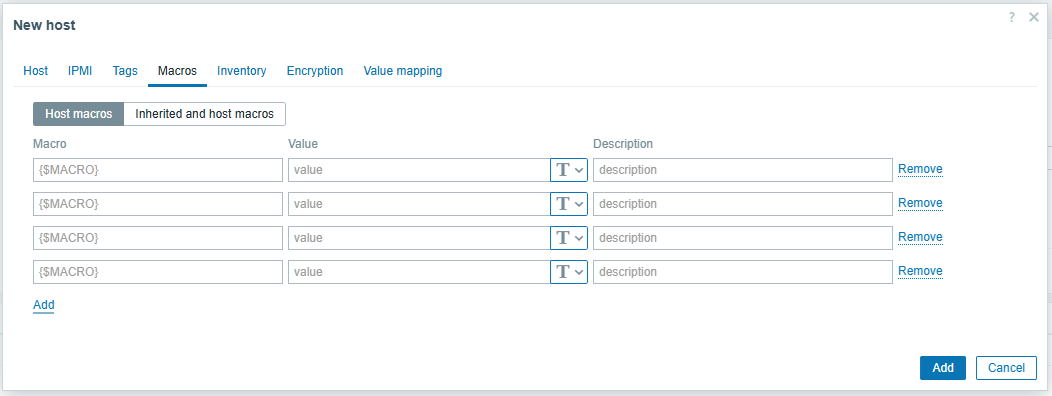
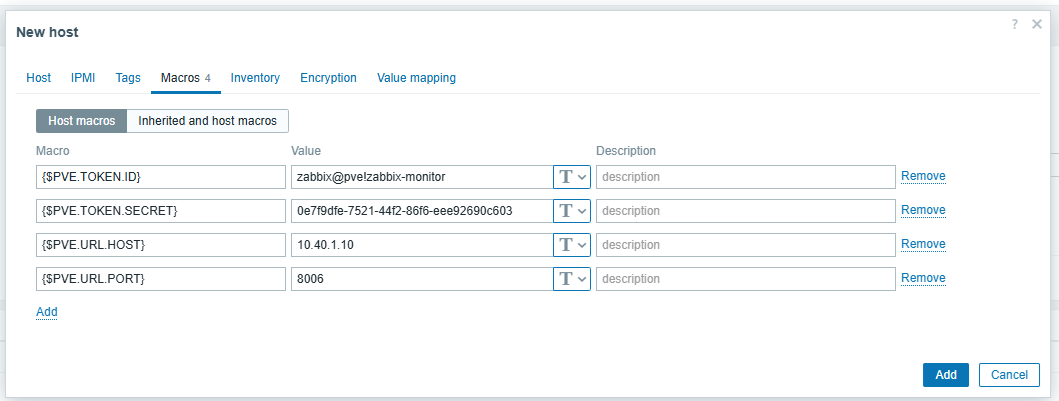
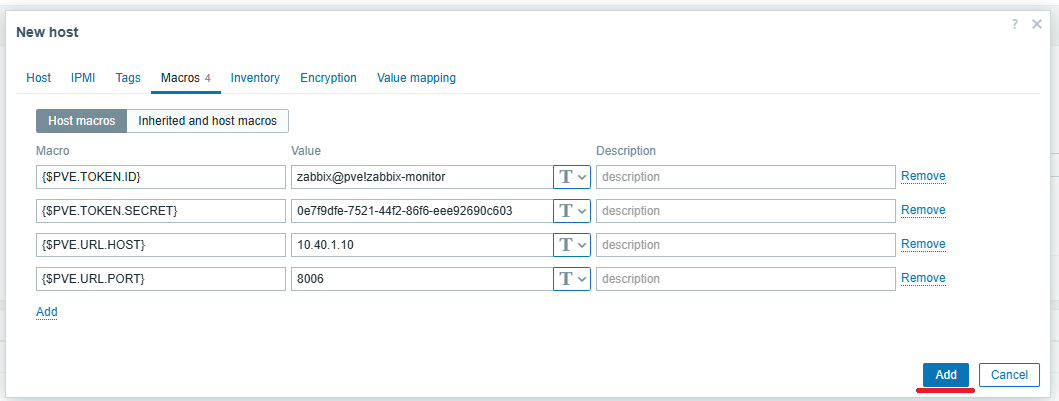
Now, let’s set the names and values for these macros as shown in the screenshot below:
- {$PVE.TOKEN.ID}: the token ID we created in Proxmox, which is zabbix@pve!zabbix-monitor
- {$PVE.TOKEN.SECRET}: the token secret from Proxmox, like 0e7f9dfe-7521-44f2-86f6-eee92690c603
- {$PVE.URL.HOST}: here, enter the IP address of the Proxmox server. In my case, it’s 10.40.1.10
- {$PVE.URL.PORT}: the last parameter is the port for the Proxmox Web UI. By default, it’s 8006
After filling in this data it should look like below
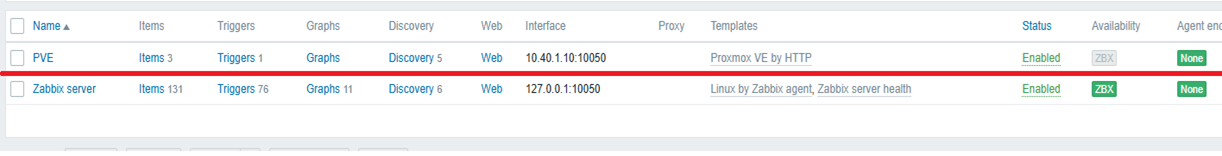
Once all the necessary parameters are set, you can add the host by clicking ADD in the bottom right corner
You should now see your Proxmox server in the list
Next, go to Monitoring from the left menu, then select Hosts
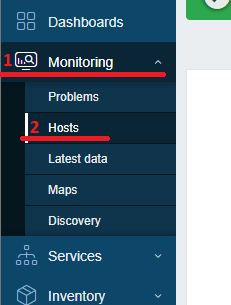
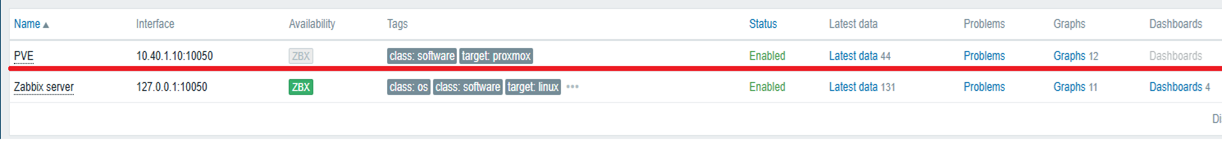
Your Proxmox server will also appear in this list.
Zabbix will have already pulled in some data that you can review.
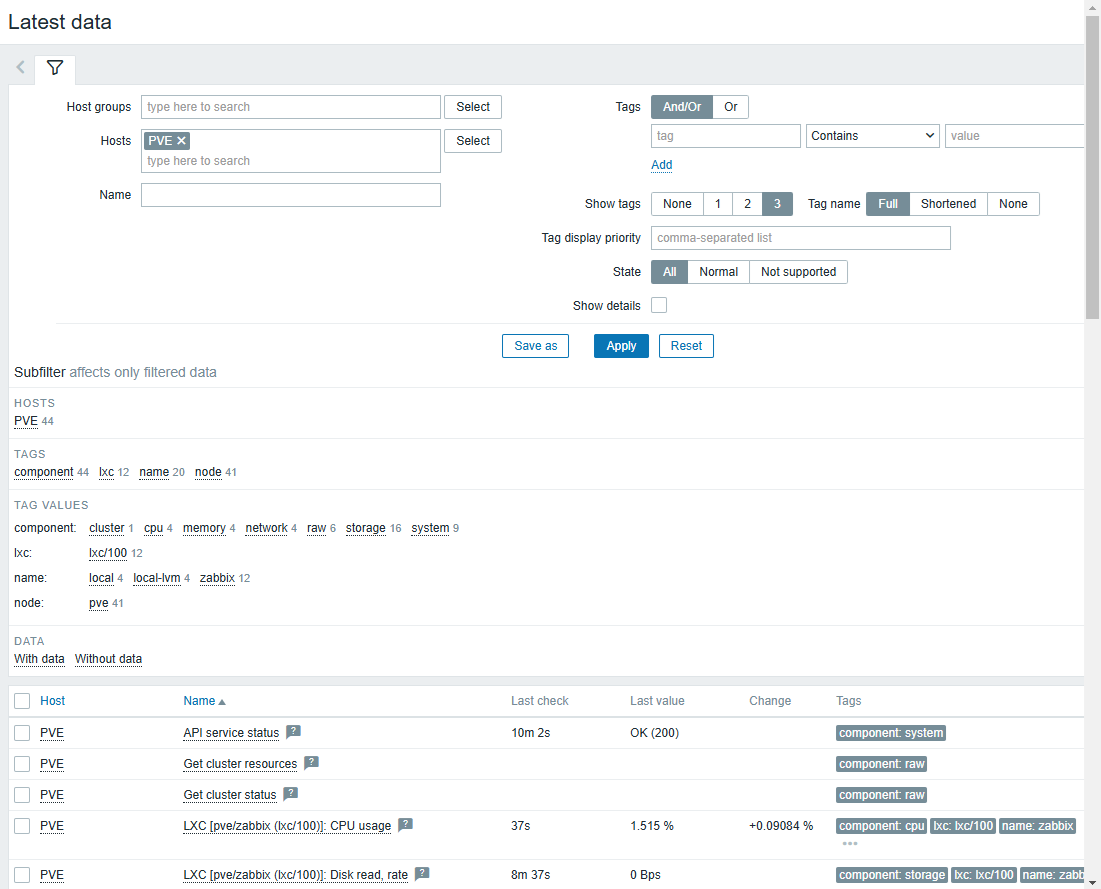
Under Latest data, you’ll see 44 parameters or more depending on your configuration, and there are 12 graphs available or more.
If, when you check the list, you only see 3 parameters under Latest data, don’t worry!
Zabbix just needs 2-3 minutes to pull in the necessary data
Now, click on Latest data, and on the new page, you’ll see all the parameters Zabbix has pulled in
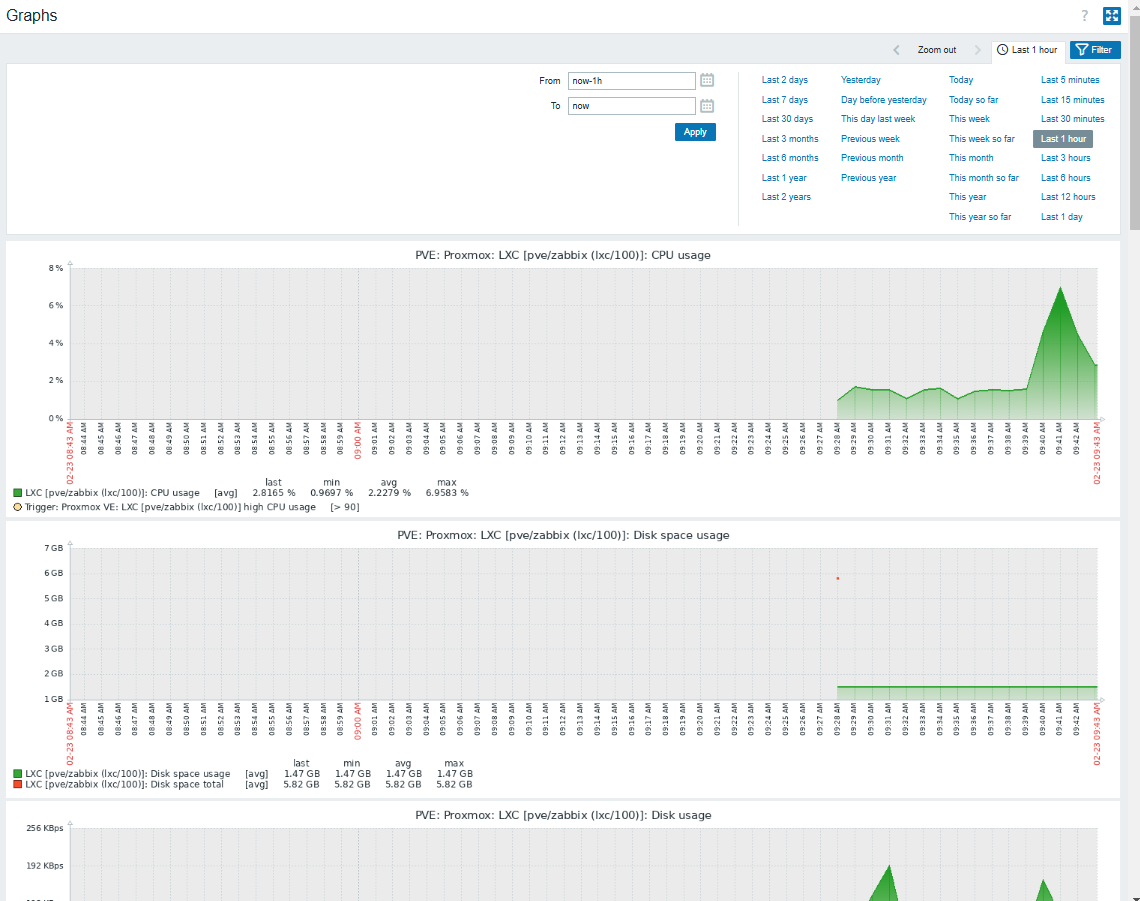
When you go back to the hosts list and select Graphs, you’ll be able to see available graphs like:
- CPU usage for virtual machines and LXC containers
- Disk usage for VMs and LXC containers
- Memory usage
- Network usage
Summary
In these few steps, we’ve set up monitoring for the Proxmox server using Zabbix, and you can check it anytime.
I won’t go through every single parameter this monitoring provides, but feel free to check out the official Zabbix documentation for more details.
You can find it here -> https://www.zabbix.com/manuals.
I hope you liked this guide and that it will be useful to you!
If you have any questions or aren’t sure about something, feel free to drop a comment below!
Thanks for sticking with me to the end!
Cheers,
Lukas
comments powered by Disqus